 B
BBricks
AI data analyst that turns CSV, Excel, and PDF files into dashboards and reports in seconds
About Bricks
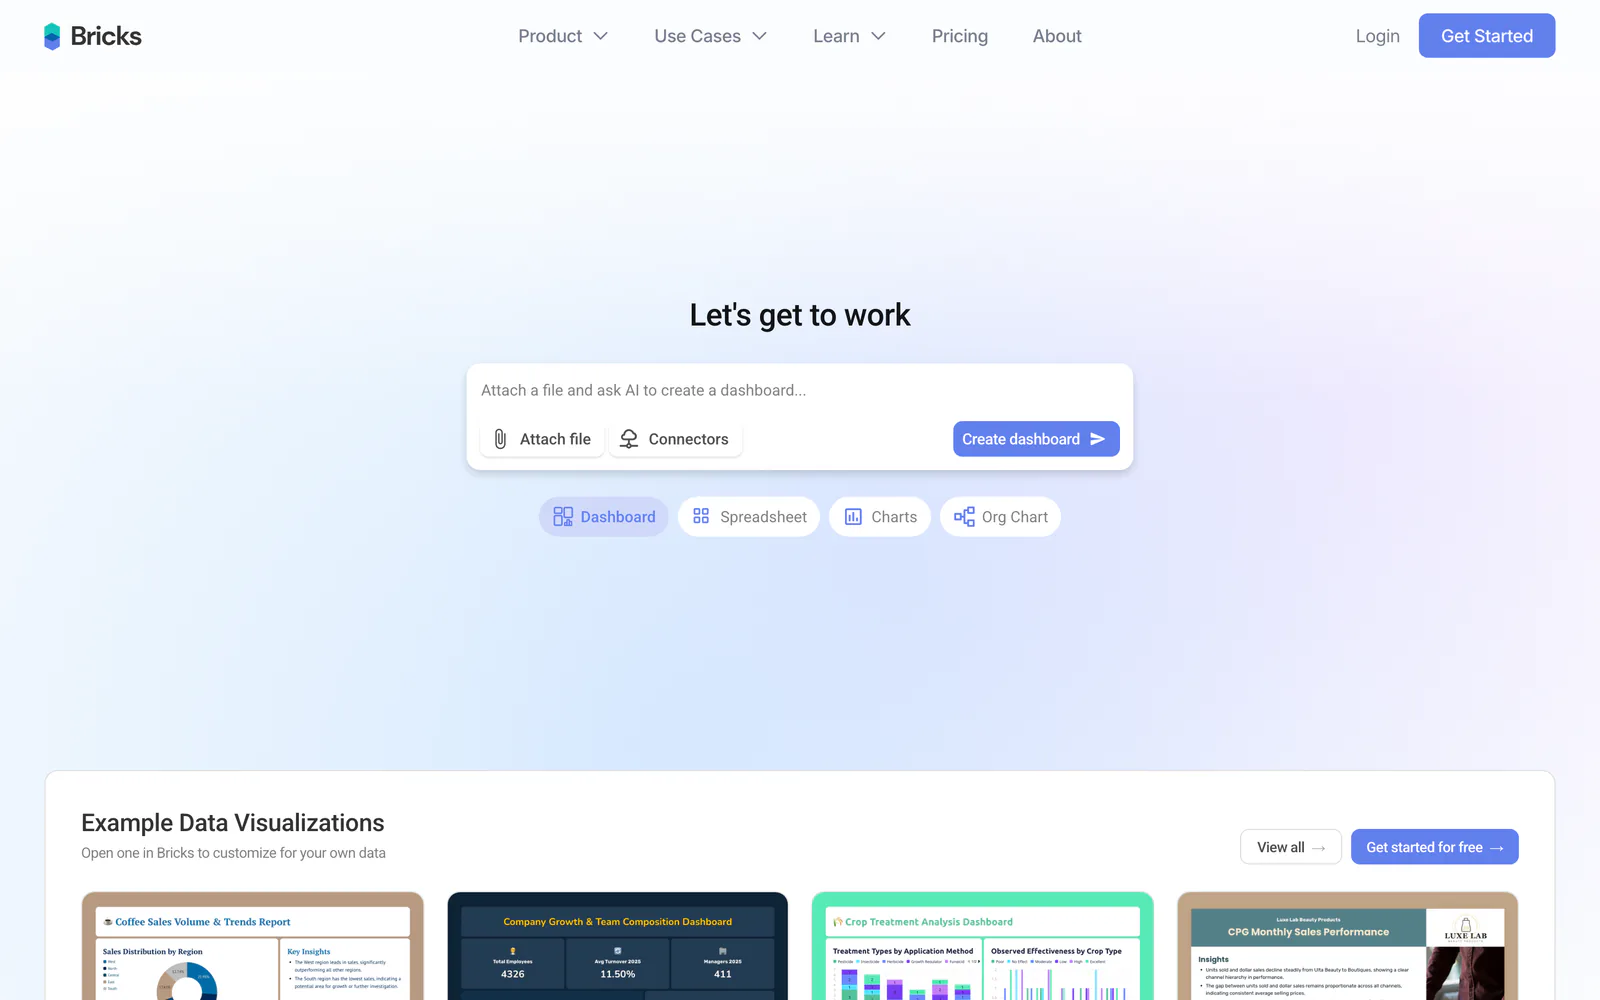
Bricks is for people whose job includes the sentence "can you put this in a dashboard?" It compresses the path from raw file to presentable output: upload a CSV, Excel file, or PDF, and the AI reads the data, picks sensible visualizations, and lays out a professional dashboard or report — then takes edits through chat like a designer-analyst hybrid.
The product's center of gravity is the deliverable, not the analysis session. Brand themes keep client work consistent, exports cover PDF, PowerPoint, Excel, and HTML, dashboards can be embedded live, and Pro adds Tableau and Power BI exports for teams that ultimately live in enterprise BI. That makes Bricks especially strong for agencies, consultants, and operators who produce recurring reports for other people and currently lose hours to chart formatting.
The tradeoffs mirror the focus. Data arrives mostly by upload — live connectors are a Pro feature — so continuously synced reporting is not the default motion. Message metering makes long exploratory sessions a Pro-tier habit. And as a newer product, it lacks the decade of enterprise hardening behind incumbent BI. Bricks wins when the job is transforming files into polished, shareable insight with the least manual work in between.
Screenshots
Cropped product views. Open one for the full capture.
Key Features
Pricing Plans
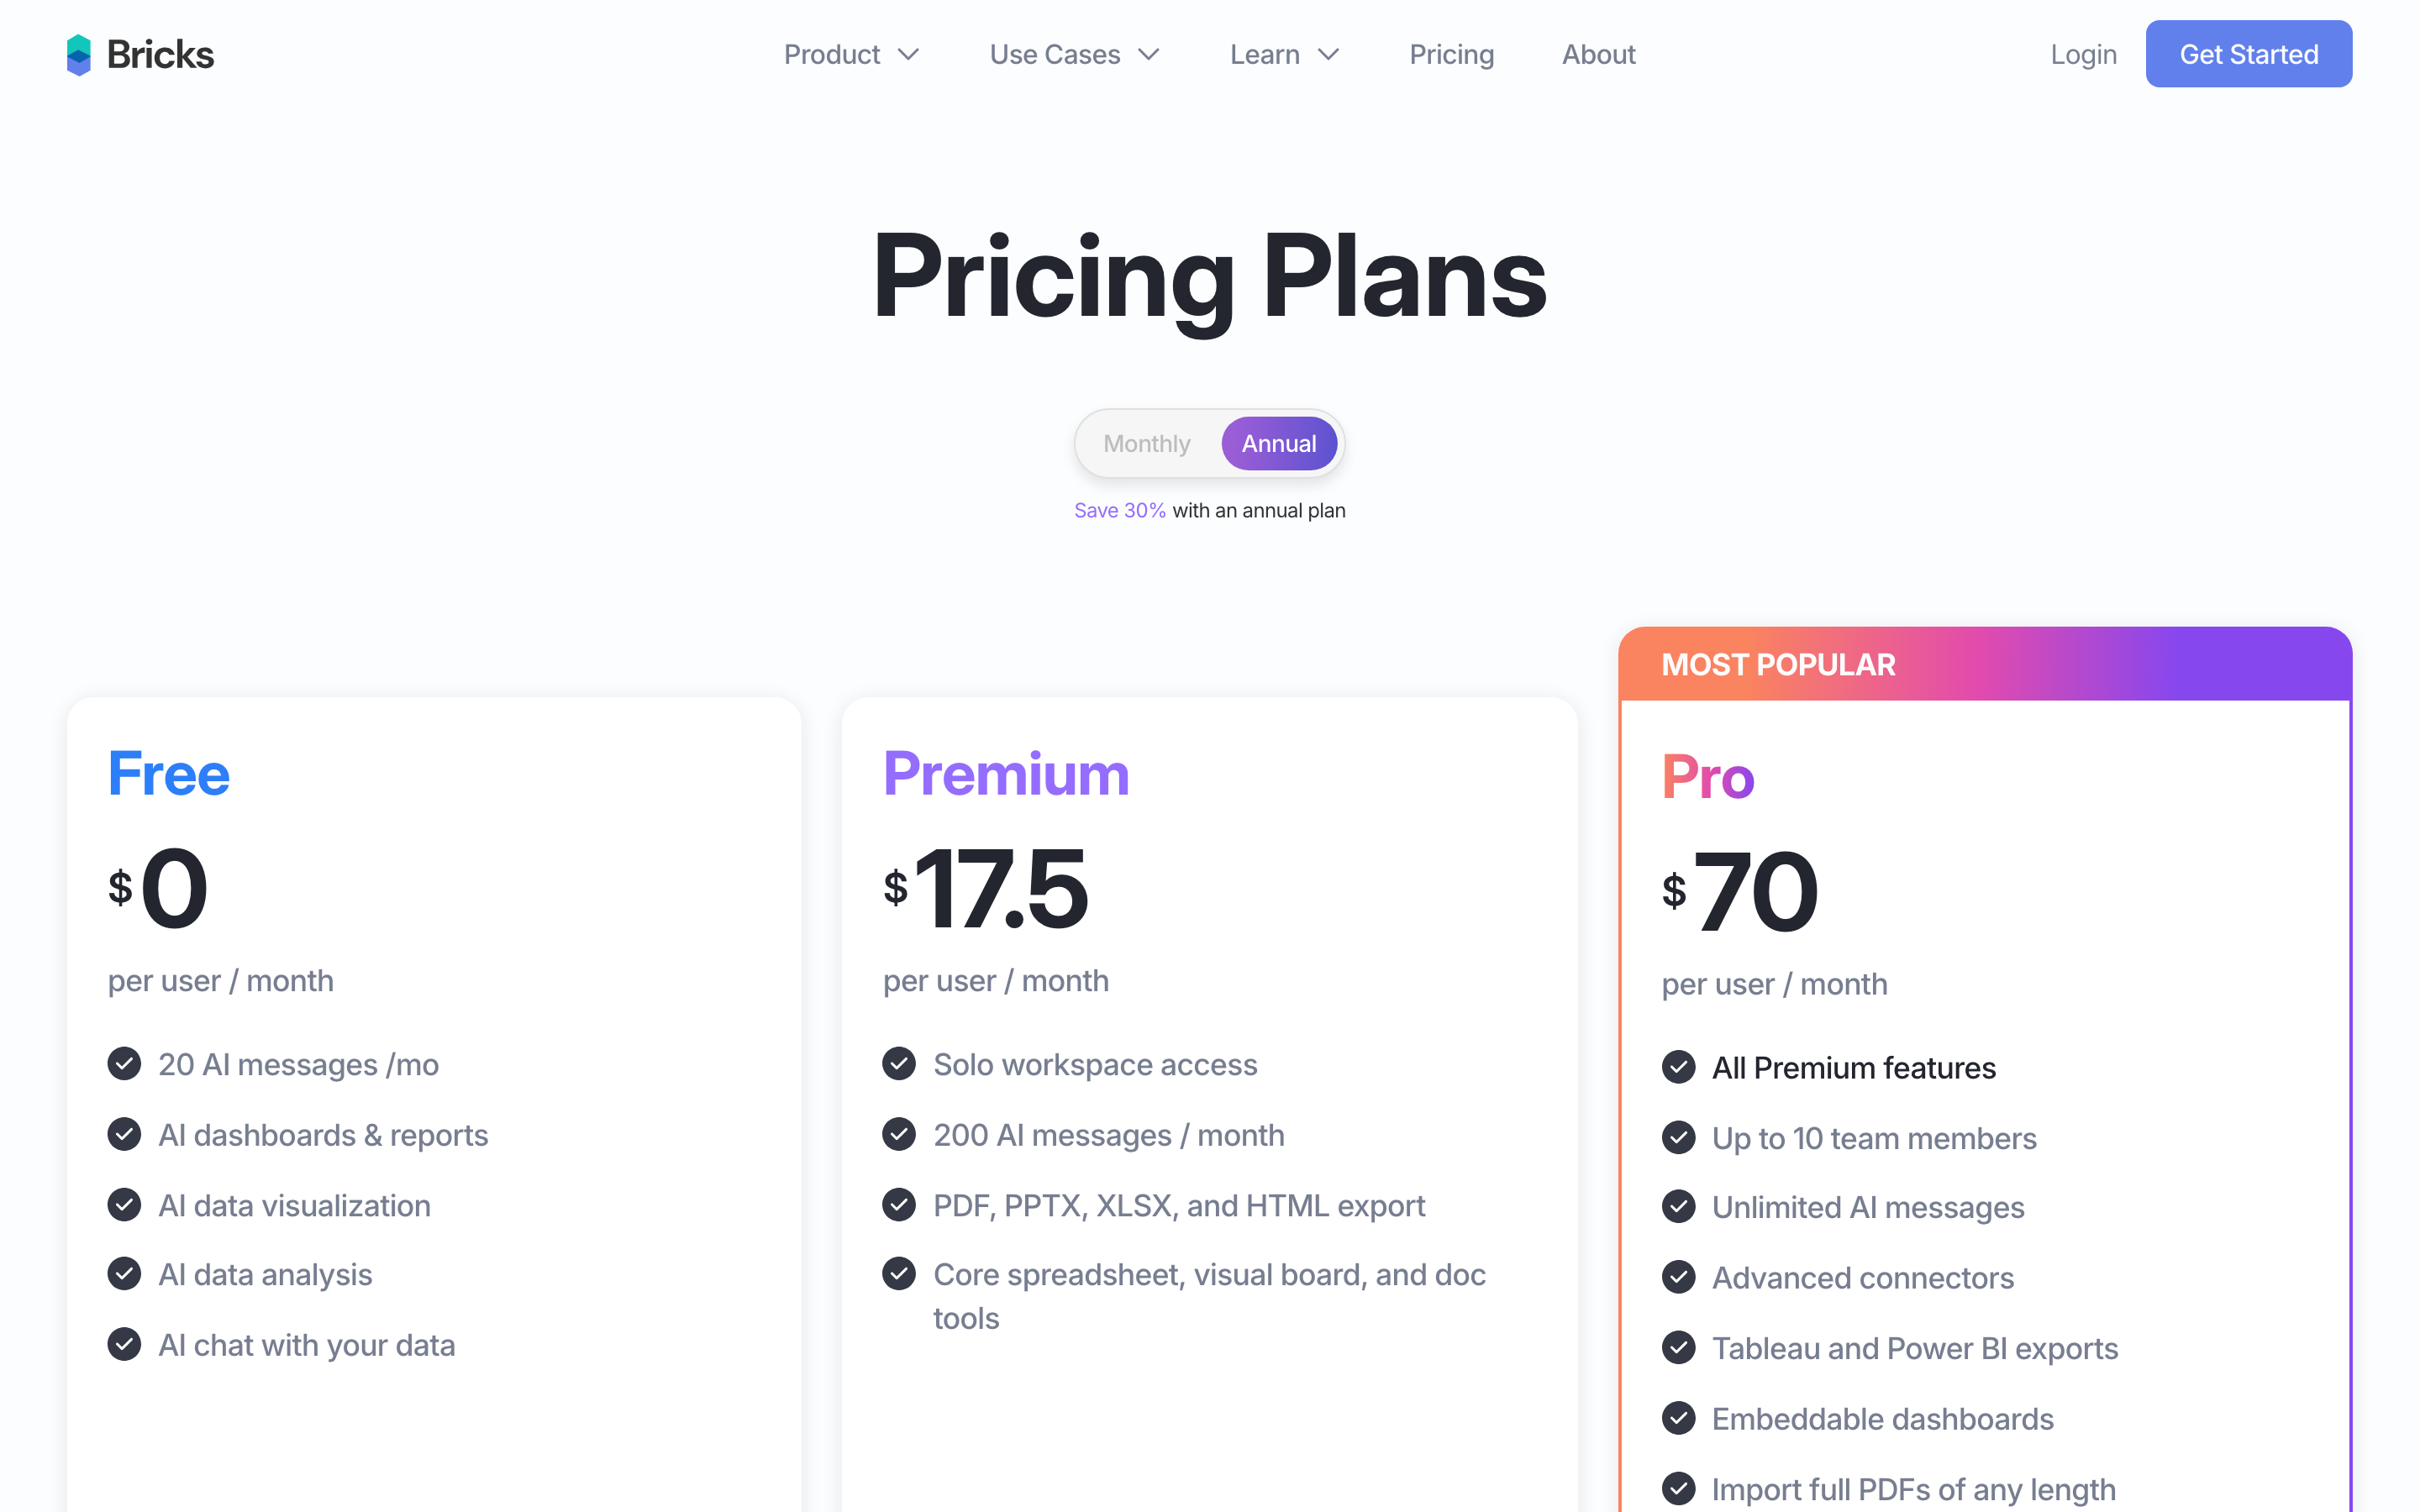
Estimate this tool in your stackBricks meters usage in AI messages — each prompt counts as one, whether it creates a dashboard, edits a chart, or asks for analysis. The Free plan includes 20 messages a month for teams up to 3, enough to see the upload-to-dashboard loop work. Premium at $25/month ($17.50 annual) raises that to 200 messages and adds the export formats — PDF, PPTX, XLSX, HTML — plus spreadsheet and visual board tools. Pro at $100/month ($70 annual) removes the message cap entirely and adds advanced connectors, Tableau and Power BI exports, embeddable dashboards, full PDF imports, and priority support. The practical read: Premium suits an individual producing periodic client or stakeholder reports, while Pro's unlimited messages fit daily analytical work or agency-style reporting across clients. Annual billing saves about 30%, which is meaningful at Pro's price point.
Free
- 20 AI messages per month
- AI dashboards and reports
- Data visualization and analysis
- Teams up to 3
Premium
- 200 AI messages per month
- PDF, PPTX, XLSX, HTML exports
- Spreadsheet and visual board tools
- Solo workspace access
Pro
- Unlimited AI messages
- Advanced connectors
- Tableau and Power BI exports
- Embeddable dashboards
- Full PDF imports
- Unlimited brand themes
- Priority support
Use Cases
Limitations
- AI message caps on Free and Premium constrain iterative analysis sessions
- Upload-centric: live data connections are gated to the Pro tier's connectors
- Newer product with a shorter track record than incumbent BI tools
- Complex statistical modeling is beyond its dashboard-first scope
Frequently Asked Questions
How is Bricks different from Rows or Formula Bot?
What counts as an AI message in Bricks?
Can Bricks replace Tableau or Power BI?
Alternatives & Related Tools
Compare adjacent tools without leaving the directory.

Formula Bot
Now Better Analyst: AI data analysis for formulas, charts, and dashboards

Gamma
AI presentation and document builder for fast storytelling

Julius AI
AI data analyst for spreadsheets, charts, and natural-language analysis

Rows
The AI-powered spreadsheet that imports live business data and analyzes it for you
Related Articles, Guides, Answers, Comparisons & Calculators
Articles
No related articles yet.
Guides & Help
No related guides yet.
Comparisons
Calculators
No related calculators yet.